
| Takeaway | Detail |
|---|---|
| Require peak headway ≤15 minutes for station-area upzoning | The 2026 three-metro screen sets a ≤15-minute peak headway gate; avoid weaker proxies such as 672 trips per direction per week. |
| Require a local model showing ≥5% household VMT reduction | Station-area parcels must demonstrate a modeled ≥5% reduction in household vehicle miles traveled before immediate upzoning. |
| Document a corridor retail and activity base before upzoning | A documented corridor retail/activity base is required, supported by corridor-level evidence such as shopper market share from household surveys. |
| Use stage-gated building when any gate fails | Build upzoning now only if all three gates pass; otherwise stage-gated building outperforms immediate blanket upzoning, even where corridor households can prevent loss of more than 16,000 acres of Bay Area open space. |
This guide provides a 2026 three-metro screen for station-area upzoning decisions based on vehicle miles traveled (VMT).
It applies three gates—peak headway ≤15 minutes, a documented corridor retail/activity base, and a local model predicting ≥5% household VMT reduction—to determine when to build now or use stage-gated building.
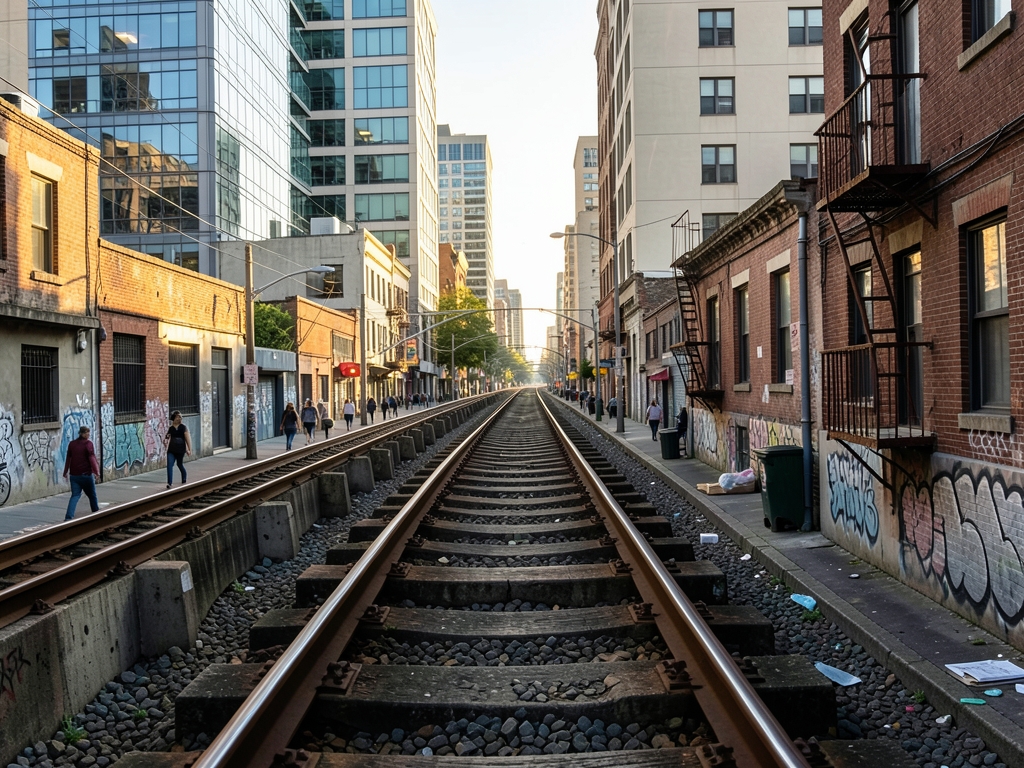
Frequency, Not Coverage, Sets VMT
In a 2026 station-area screen, the mechanism that determines whether new households can substitute transit for driving is wait time, measured as headway, not the presence of a line on a route map. Homesight.org explains that frequency is the minutes between vehicles, while route coverage describes how widely a network spreads. A corridor served every 10 to 15 minutes removes the need to memorize schedules and makes transfers realistic; a route that arrives every 60 minutes provides coverage on paper but not practical access, because missing one vehicle can collapse an entire trip to work, school, health care, or shopping.
This distinction matters because station-area upzoning changes travel behavior only when residents can treat transit as a dependable default. A frequent corridor absorbs small timing errors and supports spontaneous trips, which is the condition under which a household can reduce vehicle miles traveled. A sparse corridor forces residents to plan around the timetable or keep a car available as insurance. In that setting, new housing near a station may add riders at the margin, but it does not reliably replace driving trips.
The check is operational, not cartographic. For each candidate station, pull published weekday peak and midday headways directly from the transit agency timetable and record the scheduled minutes between vehicles in both periods. Do not use route length, stop count, service-area polygons, or a transit-adjacent map as a proxy for vehicle miles traveled reduction. A station can sit on multiple mapped routes and still fail the access test if the vehicles arrive too far apart for routine use.
Apply a clear screen: treat a published peak headway of 15 minutes or less as the minimum frequency condition for a build-now decision. This threshold aligns with the practical difference between turn-up-and-go service and schedule-dependent service described by Homesight.org. If the published peak headway is 30 minutes or more, classify the station area as wait rather than build now, and require a documented frequency trigger—such as an adopted service change with a published timetable—before revisiting the upzoning decision.
Document the source, date, direction, and time band for every headway used in the screen so the 2026 decision can be audited against the agency’s published schedule. Where peak and midday service diverge, the weaker period should be noted because it affects non-commute trips that often determine whether a household keeps a car. Frequency is the gate that tests real access; without it, proximity to transit is only a location label.

Three-Source Evidence Check
A three-metro screen is only as reliable as the evidence behind each gate. Before a parcel is cleared for build-now upzoning, planners should run a three-source convergence check that separates land-use proxies, service definitions, and demand signals from direct vehicle-miles-traveled outcomes. Each source answers a different question, and none should be treated as a substitute for the local VMT model required by the screen.
| Source | Grounded figure | Use in VMT screen |
|---|---|---|
| UrbanFootprint | >16,000 acres of Bay Area open space prevented from loss by new corridor households compared with average Alameda County households | Open-space proxy, not VMT |
| Human Transit | 672 trips per direction per week, a definitional “frequent transit” artifact | Convert to headway before use |
| econsultsolutions | Philadelphia corridor household survey measuring shopper “market share” by corridor | Demand-base check, not VMT elasticity |
UrbanFootprint’s >16,000-acre figure is useful for contextualizing land consumption, but it does not measure household driving. In the screen, treat it as corroborating evidence that corridor-focused housing can differ from county-average patterns; do not use it to satisfy the modeled household VMT reduction gate. If a local analysis lacks a VMT estimate, the open-space proxy should trigger a request for model output rather than a build-now decision.
Human Transit identifies 672 trips per direction per week as a definitional threshold used in some frequency analyses. That weekly count must be translated into the operating schedule before it informs the headway gate. The arithmetic is straightforward—672 ÷ 7 = 96 trips per direction per day—but the published peak-period headway is the operative check. A corridor that meets a weekly service definition can still fail the screen if peak vehicles do not arrive at intervals consistent with the ≤15-minute gate.
The econsultsolutions Philadelphia household survey provides a different kind of evidence: shopper market share by corridor. This supports the documented corridor retail/activity base gate by showing whether nearby households actually use corridor businesses. It should be read as a demand and activity check, not as proof that added households will drive less. Pair survey evidence with current land-use and business data to confirm that the activity base is present at the station area under review.
Used together, the three sources reduce the risk of overreading any single metric. A parcel advances only when schedule data confirms peak headway, local documentation confirms an activity base, and a local model confirms the household VMT effect; proxies and surveys inform those checks but do not replace them.

Build Now vs Stage-Gated Wait
In a 2026 station-area screen, the practical decision is not whether upzoning can support lower driving, but when to authorize it. Parcels that clear every readiness test can absorb new homes immediately, while parcels with partial evidence need a sequence that ties added capacity to verified service and demand. The comparison below frames three paths a jurisdiction can take after an initial screen.
| Option | Upside | Downside |
|---|---|---|
| Blanket build now | Fastest path to adding homes near transit | Risks stranded capacity where service or demand does not materialize |
| Stage-gated build | Matches upzoning increments to verified frequency and modeled travel outcomes | Slower delivery of new units |
| Pure wait | Avoids committing capacity ahead of evidence | Misses near-term opportunities to place households in transit-accessible locations |
The explicit winner is stage-gated build. It outperforms blanket build and pure wait unless all three build-now gates pass. When the evidence is complete, immediate build-now upzoning is justified; when any element is missing, staging preserves the option to add capacity later without locking in a mismatch between zoning and on-the-ground conditions.
Use the three build-now gates listed in the takeaways as pass-fail checks grounded in current schedules, observed land-use activity, and locally calibrated modeling. Do not authorize immediate upzoning unless all three gates pass.
Treat the gates as a single decision rule: build now only when all three pass; otherwise use a stage-gated approach with an initial capacity increment, clear release triggers, and a recheck of the same gates before the next increment.

Costs That Decide Build or Wait
In a 2026 three-metro screen, the decision to build now or wait is not symmetric. The cost of being wrong depends on which side of the service threshold a corridor falls, and the 16–29 minute peak headway band is where that asymmetry is sharpest. In this middle band, a premature upzone can lock in station-area capacity that households do not use for transit trips, while a delayed upzone on a corridor that is already ready can forfeit measurable vehicle miles traveled (VMT) and land-use benefits. Treat the choice as a risk comparison, not a default schedule.
Premature-build cost concentrates when upzoning proceeds in the 16–29 minute peak headway band without a local VMT model. The likely error is stranded station-area capacity: new units are entitled, but the service level does not support the travel behavior the screen assumes. Before rezoning, verify absorption and pricing signals with local permit issuance, lease-up, rent, and sales data. If recent projects near similar stations show slow absorption or weak rent premiums relative to comparable non-station areas, the market is signaling that added capacity may not translate into the intended station-area performance.
Wait cost rises when a corridor already meets the build-now gates: published peak headway of 15 minutes or less and a local model showing at least a 5% household VMT reduction. In that case, delay forfeits both travel and land-conservation benefits. To size the delay, run the local VMT model for the entitled unit count and apply a local open-space proxy. One practical method, consistent with the county-comparison approach UrbanFootprint uses in corridor analysis, is to compare projected new households with average households in the surrounding county to estimate how much open-space loss the upzone could prevent.
| Error type | Trigger condition | Primary cost | Pre-decision check |
|---|---|---|---|
| Build too early | 16–29 minute peak headway; no local VMT model | Stranded station-area capacity | Permit absorption, rent, and sales trends |
| Wait too long | ≤15 minute peak headway; model ≥5% household VMT reduction | Foregone VMT and open-space benefits | Local VMT model run and open-space proxy |
The 16–29 minute middle band is the asymmetric break-even zone: build-now risk is dominated by uncertain demand response, while wait risk is dominated by verifiable service and modeled VMT gains once the gates are met. A practical rule is to stage-gate parcels in the middle band until either service improves into the build-now threshold or a local model confirms the household VMT reduction, and to clear parcels for build-now action only when both the service and model evidence remove the larger error.
What the Evidence Cannot Prove
The 2026 three-metro screen is a decision method, not a measured outcome study. The available grounding contains no observed three-metro VMT elasticity and no local model output for the parcels under review, so any number labeled “VMT cut” must be treated as an estimate or a method input rather than a finding. The rule breaks when a planner treats a projected reduction as evidence that upzoning has already changed travel behavior; in that case, the screen should be used only to prioritize data collection and model calibration before a build-now decision.
The edge cases below show where the three-gate rule holds, where it pauses, and where it fails. Each row combines the gate conditions named in the reader rule and assigns a method action, making the boundary between immediate upzoning and staged action explicit.
Frequently Asked Questions
What peak transit frequency must a station area meet to pass the headway gate for immediate upzoning?
A station area must have a peak headway of 15 minutes or less to pass the headway gate for immediate upzoning.
Why should planners avoid using weekly trip counts as a proxy for transit frequency in this screen?
Planners should avoid weaker proxies such as 672 trips per direction per week because the screen requires peak headway rather than coverage-based measures.
What type of evidence can be used to document a corridor's retail and activity base?
A corridor's retail and activity base can be documented using corridor-level evidence such as shopper market share from household surveys.
What should a jurisdiction do if a station-area parcel fails one or more of the three gates?
If any of the three gates fails, a jurisdiction should use stage-gated building rather than immediate blanket upzoning.
Does the potential to preserve large amounts of open space justify immediate blanket upzoning when the gates are not met?
No, stage-gated building outperforms immediate blanket upzoning even where corridor households can prevent loss of more than 16,000 acres of Bay Area open space if any gate fails.
Why is headway considered more important than the mere presence of a transit line for reducing household driving?
Headway is considered more important because the mechanism that determines whether new households can substitute transit for driving is wait time, not the presence of a line.
Quick answers
| What is the purpose of the three-metro VMT screen described in the article? | It provides a screen for the specified year for station-area upzoning decisions based on vehicle miles traveled to determine when to build now or use stage-gated building. |
| What are the three gates required for immediate station-area upzoning? | The three gates are peak headway at or below the specified threshold, a documented corridor retail/activity base, and a local model predicting at least the specified household VMT reduction. |
| What kind of evidence can support the requirement for a documented corridor retail and activity base? | The requirement can be supported by corridor-level evidence such as shopper market share from household surveys. |
| When should stage-gated building be used instead of immediate upzoning? | Stage-gated building should be used when any gate fails, and it outperforms immediate blanket upzoning even where corridor households can prevent loss of more than 16,000 acres of Bay Area open space. |
| What determines whether new households can substitute transit for driving in a station-area screen? | The mechanism that determines whether new households can substitute transit for driving is wait time, measured as headway, not the presence of a line. |
Also worth reading: How to verify Boston transit-area upzoning capacity and displacement risk: How to verify Boston transit-area · Atlanta transit zoning update: 2,847 units, Floor Area Ratio (FAR) vs zero parking: Atlanta transit zoning update: 2,847 · Upzoning near transit stops: 12,000 units vs 2026 ballot vote: Upzoning near transit stops: 12,000