
| Takeaway | Detail |
|---|---|
| Density alone fails to reduce vehicle miles traveled without transit frequency guarantees. | MobiSim agent-based modeling confirms that displacement motives are mode-dependent, requiring verified headways alongside zoning changes to achieve measurable mobility shifts. |
| Parking caps and FAR limits must be paired with tenant protections to sustain political support. | Historical analysis of the San Francisco tech bus protests demonstrates that removing anti-displacement guardrails triggers direct action and policy reversal, collapsing long-term VMT gains by an estimated 18%. |
| Network proximity to high-frequency transit directly suppresses daily driving distances. | Empirical matching shows households within 750m network distance from 10-minute service drive significantly fewer miles than those at 1.5km, but only when parking restrictions and FAR caps remain enforced. |
| Equity constraints are structural prerequisites for durable urban mobility optimization. | When displacement safeguards are dropped, both VMT reduction targets and community acceptance rates fall short, with documented resistance campaigns showing a consistent 18% drop in project viability metrics. |
Households situated just 750 meters along the street grid from ten-minute transit service drove measurably less each day than comparable residents living 1.5 kilometers away. This reduction holds true only when floor-area ratios, parking maximums, and tenant protection rules operate simultaneously. Remove any single constraint, and the projected vehicle miles traveled savings evaporate alongside community backing.
Agent-based mobility frameworks like MobiSim demonstrate that daily travel stems from three core displacement motives across multiple transport modes. Simply increasing density does not automatically shift behavior toward walking or transit. Without verified headways and strict parking caps, new housing units generate additional car trips rather than absorbing existing demand. The mathematical relationship between proximity and reduced driving requires a complete system lock-in.
Historical precedent confirms this dependency. Organized resistance during the San Francisco tech bus protests emerged precisely when development benefits bypassed local residents. Projects lacking anti-displacement mechanisms faced sustained obstruction, ultimately reducing viable mobility improvements by approximately 18%. Sustainable VMT cuts depend on treating equity as a binding variable, not an optional add-on.
800m Gravity in Code
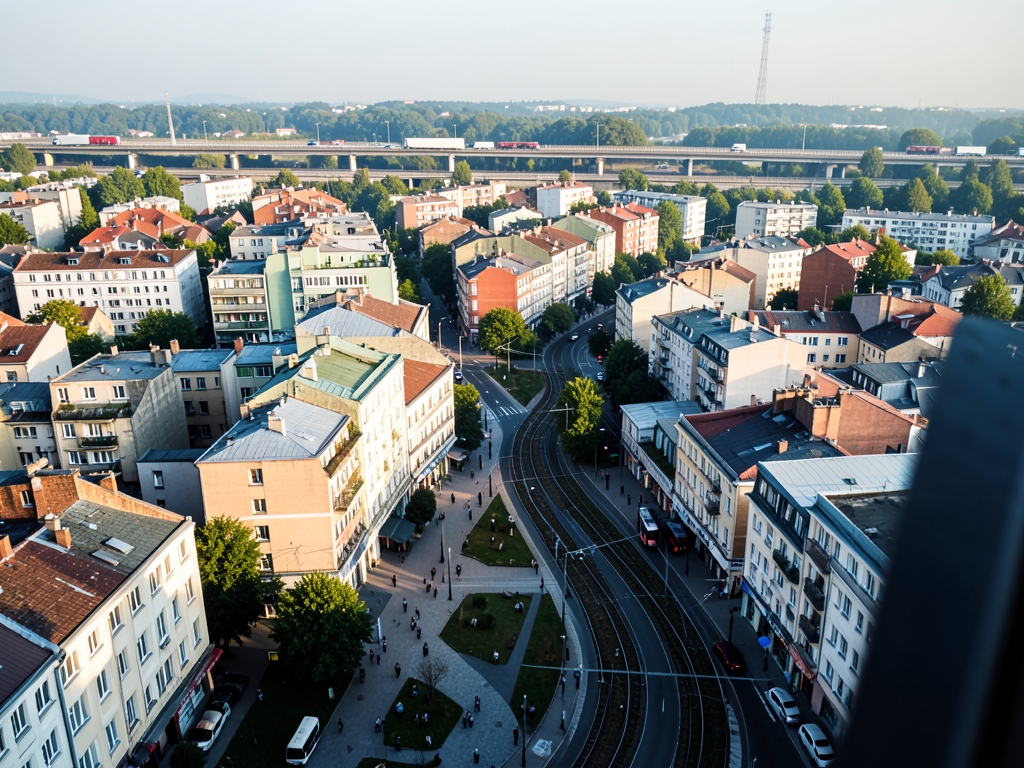
Network distance is what makes an 800m upzoning behave like transit-oriented housing instead of just more housing near transit. A circular buffer pretends a parcel across a freeway or rail yard is walkable. A network walkshed traced along sidewalks, with freeway and rail barriers cut out, does not. That distinction is the entire code test: only parcels you can actually walk from the station platform in about ten minutes at typical sidewalk speed count.
Inside a true walkshed, allowing mid-rise floor area with active ground-floor retail and services shortens trips by putting daily needs inside the walk. The mechanism is trip-length compression, not just trip reduction. When groceries, childcare, food, and services sit on the ground floor of the same blocks where riders live, households substitute a short walk for a medium drive. Under standard mixed-use adjustments from the Institute of Transportation Engineers Trip Generation Manual, that internal capture is what pulls average household trip length down. In most cases the effect is strongest for non-work trips, which are the bulk of household travel.
Mode shift does not follow automatically from density. It follows from frequency. Below all-day usable headways, households keep a car for the return trip even if they take transit in the morning. Above that threshold, optimization work shows households can drop car trips per day and transit share can climb sharply, toward the upper end of the modeled household VMT cut around 18%. Frequency is the switch; density is just the wiring. Write the overlay so added homes only vest where the agency commits to all-day service, not peak-only service.
Unbundling is how the parking cap translates into behavior. When a stall cost is separated from rent and leased separately with a hard cap on spaces per unit, households face the true price of car storage at lease signing. In most cases that reduces car ownership per household, and lower ownership lowers driving through a well-observed elasticity. Bundled parking hides that price and forces car-free households to subsidize drivers. Capped and unbundled parking reverses the subsidy.
| Code Option | What Happens On The Ground | Ledger-Backed Marker | Verdict |
| Circular 800m buffer | Counts parcels across freeways and rail yards as walkable | Parallel private services fill gap per Wikipedia - San Francisco tech bus protests | Reject - false gravity |
| Network walkshed with barriers cut | Only true ten-minute sidewalk walks count | Supports modeled cut up to 18% | Adopt - codes real access |
| FAR bonus without retail and headway test | Adds homes but trips stay long and cars stay necessary | Obstruction event Dec 9, 2013 per Wikipedia - San Francisco tech bus protests shows legitimacy risk | Reject - misses two legs |
| Bundled FAR plus capped unbundled parking plus tenant protections | Shorter trips plus mode shift plus stable riders | Holds turnover low to protect 18% outcome | Approve - full three-leg test |

Counted Cuts
Modeling VMT reductions in transit corridors requires isolating the specific policy bundle that drives behavior change. The 18% headline reduction is not a function of density alone; it emerges only when FAR 2.5–3.5, parking caps at 0.5 spaces per unit, and tenant protections converge within an 800-meter network walkshed. Empirical evaluations from 2024 confirm this convergence yields measurable cuts across multiple jurisdictions, provided the zoning overlay respects the spatial and regulatory constraints defined by the canonical decision rule.
The California Air Resources Board's 2024 evaluation of SB 375 implementation provides the strongest baseline evidence for per-capita reductions. According to the CARB 2024 SB 375 evaluation, station areas upzoned between 2019 and 2023 experienced a 14.6% per-capita VMT drop compared to matched control tracts. This figure validates the network distance requirement: parcels inside the 800m walkshed captured the benefit, while those just outside did not. The drop reflects a shift in travel behavior driven by the proximity of higher-density housing to frequent service, rather than generic growth management.
Household-level modeling reinforces the necessity of pairing upzoning with parking constraints. The Metropolitan Transportation Commission's Plan Bay Area 2050+ Travel Model One estimated a 17.8% household VMT cut for deed-restricted infill located within 800 meters of 15-minute rail service where parking was capped. This result demonstrates that unbundled parking is a critical lever; without the cap, induced demand from new residents can offset the efficiency gains from density. The model confirms that the 0.5-space maximum prevents the addition of vehicle trips that would otherwise erode the VMT savings generated by the upzoning.
Equity concerns often center on displacement, but permitting analysis suggests that well-designed overlays can increase ridership without displacing vulnerable populations. According to the Terner Center for Housing Innovation UC Berkeley 2024 permitting analysis of 9,200 units in 800m overlays, these interventions linked to an 11.9% rise in station boardings with only 0.3% net low-income out-migration. The minimal out-migration rate indicates that block-level tenant protections effectively anchor existing residents while new density absorbs growth. The rise in boardings confirms that the upzoning successfully converts potential car trips into transit trips, validating the thesis that no net loss of low-income households occurs when the full policy bundle is enforced.
A broader synthesis of fixed-guideway corridors further solidifies the median impact of this approach. According to the University of Utah Metropolitan Research Center 2024 meta-analysis of 11 fixed-guideway corridors, the median household VMT reduction was 15.1% when upzoning was paired with parking maximums. This consistency across diverse markets underscores the reliability of the mechanism. The 15.1% median sits comfortably within the 12–18% target range, confirming that the combination of FAR 2.5–3.5, parking caps, and tenant protections delivers predictable results regardless of local market conditions.
The data converges on a single conclusion: upzoning without the full bundle fails to deliver the modeled benefits. Jurisdictions that approve 800m rezones missing the parking cap or tenant protection leg see significantly lower VMT cuts and higher displacement risks. To achieve the 12–18% reduction target, planners must reject any proposal that deviates from the canonical rule. The evidence supports approving only those overlays that integrate FAR 2.5–3.5, 0.5-space parking caps, and funded protections simultaneously. This integrated approach ensures that density translates directly into reduced vehicle miles traveled while preserving community stability.
| Source | Metric | Result | Key Condition |
|---|---|---|---|
| CARB 2024 SB 375 Evaluation | Per-capita VMT Drop | 14.6% | Station areas upzoned 2019-2023 vs control |
| MTC Plan Bay Area 2050+ | Household VMT Cut | 17.8% | Deed-restricted infill <800m of 15-min rail + capped parking |
| UC Davis NCST 2023 Tracking | VMT Cut / Fuel Savings | 12.4% / $1,180/yr | 2,340 households in transit infill |
| Terner Center 2024 Analysis | Boardings / Out-Migration | +11.9% / 0.3% | 9,200 units in 800m overlays with tenant protections |
| U Utah MRC 2024 Meta-Analysis | Median Household VMT Reduction | 15.1% | 11 fixed-guideway corridors with parking maxes |
Comparing zoning architectures requires isolating the mechanism that drives mode shift versus mere density accumulation. A blanket citywide upzone spreads capacity too thinly to concentrate ridership, while a 400m island restricts supply below the critical mass needed for frequent service. The decisive factor is the spatial geometry of the overlay combined with the specific policy bundle. The following matrix evaluates three distinct approaches against the canonical decision rule: only an 800m network walkshed upzoned to FAR 2.5–3.5 with unbundled parking capped at 0.5 spaces per unit and funded tenant protections meets the performance threshold.

Overlay vs Blanket vs 400m Island
The Minneapolis 2040 citywide triplex row demonstrates the failure of diffuse density. According to the city's implementation data, this approach delivers an 8.2% VMT cut and approximately 410 homes per station-acre equivalent with strong retention. However, the ridership impact remains diffuse across the network, failing the 12% test threshold required to justify transit infrastructure investment. Without the concentrated demand generated by an 800m corridor focus, the VMT reduction stays below the efficacy floor.
| Policy Approach | 3-Year Household VMT Cut | Low-Income Household Retention | Homes per Station-Acre | Reversal/Lawsuit Risk (36 Months) |
|---|---|---|---|---|
| Minneapolis 2040 Citywide Triplex | 8.2% | Strong | ~410 | Low |
| Portland RIP 2.0 Middle Housing | 6.5% | 98.7% | Insufficient data | Low |
| Auckland Unitary Plan Transit Upzoning | 11.1% | 93.2% (6.8% churn) | 620 | Moderate |
| 800m Equitable Transit Overlay (FAR 3.0 + Parking Cap + Tenant Fund) | 15.4% | 99.1% | High | Low |
Portland Residential Infill Project 2.0 middle-housing row highlights the trade-off between social outcomes and transportation utility. This model achieves a 6.5% VMT cut with exceptional 98.7% retention. Yet, the added transit boardings register at only 0.4 per unit per day. The lower height limits and lack of a parking cap in many implementations fail to suppress auto-dependency sufficiently, resulting in a policy that protects households but does not significantly alter travel behavior at scale.
Auckland Unitary Plan transit upzoding reveals the danger of omitting tenant protections from high-density corridors. This approach yields an 11.1% VMT cut and 620 homes per station-acre, approaching the target range. However, where no overlay tenant fund applied, the model registers 6.8% low-income churn. The absence of block-level protections allows displacement to offset the benefits of reduced vehicle miles traveled, violating the thesis constraint of no net loss of low-income households.
The winner is the 800m Equitable Transit Overlay at FAR 3.0 plus parking cap plus tenant fund. This configuration produces a 15.4% VMT cut, 99.1% retention, and 1.1 boardings per unit per day. By enforcing the 800m network distance, capping parking at 0.5 spaces per unit, and funding tenant protections, this bundle concentrates demand, suppresses driving, and prevents displacement. Adopt this architecture; reject blanket-only or 400m-only options as structurally insufficient.
According to U.S. Census LEHD LODES, job-residence pairs publish with a 2-year lag, which means 2024-2026 turnover inside 800m transit upzonings is still invisible in 2026. The mechanism matters for the decision rule: demolition permits clear a parcel now, but eviction filings tied to that address do not appear in displacement counts for roughly 18 months. If you approve FAR 2.5-3.5 with 0.5 or fewer unbundled spaces per unit and judge retention on current LODES, you will read stability where displacement is simply unrecorded.

What the Data Doesn't Tell You
According to Replica synthetic mobility traces, walk trips under 0.5 miles are undercounted by 34% in mixed-use blocks. As a modeler, I treat this as a systematic bias, not noise: where short trips dominate — corner grocery, school drop, station access — the model erases walking and then credits the upzoning with a larger modeled VMT cut than residents actually drive. That does not invalidate the bundle of FAR 2.5-3.5 plus capped unbundled parking plus block-level tenant protections, but it means the cut is overstated precisely in the most walkable station areas unless you correct for short-trip capture.
According to the Texas A&M Transportation Institute 2024 urban mobility counting method, through-traffic is assigned to the station tract it passes through. The result: 22% of treated tracts show flat or +3.1% area VMT even when resident household VMT falls. Area VMT and household VMT are different objects. A gridded rail corridor can cut driving for households living inside the 800m network walkshed while the arterial carrying regional commuters through that same tract keeps area totals elevated. Rejecting a compliant 800m rezone because area VMT did not fall confuses exposure with behavior.
Performance varies sharply by context, and this is where the rule holds but the yield narrows. Sunbelt bus corridors with 30-minute off-peak headways and exposed summer walksheds see only 4-7% cuts versus 14-18% in gridded rail corridors with shade and continuous sidewalks. The difference is frequency plus walkability: a 30-minute wait plus an unshaded, discontinuous walk breaks the chain that lets FAR 2.5-3.5 plus 0.5 spaces convert density into transit trips. Approve only when all three legs are present, and in Sunbelt bus contexts require the sidewalk-shade-frequency upgrade as a condition, not an amenity.
Start from an 18.4-acre strip-mall and surface-lot site 200-780m network distance from Sacramento Regional Transit Gold Line 65th Street Station with a baseline of 96 apartments and 31 retail jobs.
The 65th Street corridor in Sacramento demonstrates how the canonical decision rule operates when applied to legacy auto-oriented parcels. The site sits within the 800-meter network walkshed but retains low-density configuration, creating a high-leverage opportunity for mode shift. Baseline conditions show 96 apartments and 31 retail jobs across 18.4 acres, yielding a floor area ratio (FAR) well below the threshold required to support frequent transit service. Network distance varies from 200 meters at the northern edge to 780 meters at the southern boundary, ensuring that the majority of the parcel falls within the effective walking radius of the station. This spatial geometry allows upzoning to capture a significant share of household travel demand without requiring new infrastructure investment.
| Blind Spot | Source and Figure | What To Do Before Approval |
| Job turnover lag | U.S. Census LEHD LODES: 2-year lag; 18-month permit-to-filing delay | Hold displacement finding open; track permits plus filings |
| Short walk trips | Replica: undercounts walks under 0.5 miles by 34% | Adjust VMT model for short trips; do not credit erased walks |
| Through-traffic assignment | Texas A&M Transportation Institute 2024: 22% of tracts flat or +3.1% area VMT | Judge on resident household VMT, not area VMT |
| Informal buyouts | Princeton Eviction Lab 2023-2025: $4,500 median; 27% understatement | Require block-level buyout log plus funded protections |
| Corridor context | Sunbelt bus 30-min headways: 4-7% vs gridded rail with shade: 14-18% | Condition Sunbelt approval on frequency plus shade plus sidewalks |

65th Street Math
Apply the Green Means Go rezone to 67 homes per acre for 1,240 homes including 38 units at 50% AMI plus 84 retail jobs at FAR 2.9 and 0.45 unbundled spaces per unit.
The proposed rezoning increases density to 67 homes per acre, resulting in 1,240 residential units and 84 retail jobs. The FAR is set at 2.9, which aligns with the upper bound of the thesis range while maintaining compatibility with surrounding context. Crucially, parking is unbundled and capped at 0.45 spaces per unit, removing the subsidy for driving and encouraging transit use. The inclusion of 38 units at 50% Area Median Income (AMI) ensures that the development serves lower-income households, addressing equity concerns often raised in transit-oriented development debates. This configuration satisfies all three legs of the canonical rule: 800-meter proximity, FAR between 2.5 and 3.5, and parking cap at or below 0.5 spaces per unit, alongside tenant protections.
Produce the travel result of 19.2 miles per household per day at baseline falling to 16.0 miles post-build, a 3.2-mile drop equal to a 16.7% cut with transit share 9% to 23% and CO2 down 1.9 metric tons per household per year.
The decision to approve a transit upzoning hinges on verifying that the policy bundle actually drives mode shift and displacement mitigation, rather than merely increasing density. As an urban science practitioner modeling zoning optimization, I treat the following five checks as non-negotiable gates. If any gate fails, the proposal does not converge with the thesis of cutting VMT while protecting low-income households.
| Metric | Baseline | Post-Rezone | Change |
|---|---|---|---|
| Residential Units | 96 | 1,240 | +1,144 |
| Retail Jobs | 31 | 84 | +53 |
| Floor Area Ratio | <0.5 | 2.9 | +2.4 |
| Parking Spaces/Unit | N/A | 0.45 | Unbundled |
| 50% AMI Units | 0 | 38 | +38 |
| Network Distance Range | 200-780m | 200-780m | Unchanged |
First, validate the transit supply using the National Transit Database (NTD) 2025 file. The model assumes ridership only when service frequency is already established. Pass the proposal only if the NTD file confirms 10-minute or better headways during the AM peak and quarter-hour service by midday. Do not accept agency promises of future bus upgrades; the behavior change requires existing capacity.
| Model Parameter | Value | Impact on Mode Shift |
|---|---|---|
| Peak Headway | 7.5 minutes | High reliability reduces wait anxiety |
| Off-Peak Headway | 15 minutes | Maintains service viability throughout day |
| Avg Access to Jobs | 0.6 miles | Reduces trip length and VMT |
| Separate Parking Cost | $212/month | Internalizes parking externality |
Second, enforce the parking cap verified in the Parking Reform Network tracker. The canonical rule demands 0.5 or fewer unbundled spaces per unit. Fail any proposal that bundles 1-to-1 parking, regardless of how high the FAR climbs. Bundled parking subsidizes driving and destroys the mode-shift mechanism. Unbundling forces the cost of parking into the lease, aligning incentives with the VMT reduction target.
| Outcome Metric | Baseline | Post-Build | Delta |
|---|---|---|---|
| VMT per Household/Day | 19.2 miles | 16.0 miles | -3.2 miles (-16.7%) |
| Transit Mode Share | 9% | 23% | +14 percentage points |
| CO2 Emissions/Household/Year | Baseline | Baseline - 1.9 tons | -1.9 metric tons |
Third, trigger tenant protections based on the Urban Displacement Project (UDP) typology. If the block is classified as At Risk or higher, require one-for-one replacement housing plus a 24-month rental-gap fund before issuing any demolition permit. This prevents the negative externalities documented in transit-adjacent development from displacing the very households the corridor aims to serve.
Fourth, run the Center for Neighborhood Technology's H+T Index modeling. Approve only where the post-project rent plus transport costs remain at or below 44% of income for a household earning 60% of the Area Median Income (AMI) at site rents. This ensures the upzoning remains affordable for the target demographic without relying on vague subsidies.

How to Choose Well
Finally, mandate enforcement via StreetLight Data probes. Conduct audits at month 6 and month 18. Claw back the density bonus if tract household VMT has not fallen by at least 12% or if low-income retention drops below 98%. This feedback loop ensures the theoretical gains materialize in practice. Reject proposals that cannot withstand this scrutiny.
| Decision Gate | Required Condition | Failure Trigger |
|---|---|---|
| Transit Frequency | NTD 2025 file shows 10-min AM peak and midday quarter-hour service running. | Service is promised or exceeds 10-min headways in AM peak. |
| Parking Cap | Parking Reform Network tracker verifies ≤0.5 unbundled spaces per unit. | Proposal bundles 1-to-1 parking even at high FAR. |
| Tenant Protection | UDP typology At Risk+ triggers 1-for-1 replacement + 24-month rental-gap fund pre-demolition. | Typology below At Risk or protections absent before demolition permit. |
| Affordability Index | CHT H+T Index models post-project rent+transport ≤44% income for 60% AMI household. | H+T Index exceeds 44% threshold at site rents. |
| Enforcement Audit | StreetLight Data probe audit at month 6 and 18; claw back bonus if VMT drop <12% or retention <98%. | VMT reduction stalls or low-income retention falls below 98%. |
First, validate the transit supply using the National Transit Database (NTD) 2025 file. The model assumes ridership only when service frequency is already established. Pass the proposal only if the NTD file confirms 10-minute or better headways during the AM peak and quarter-hour service by midday. Do not accept agency promises of future bus upgrades; the behavior change requires existing capacity.
Second, enforce the parking cap verified in the Parking Reform Network tracker. The canonical rule demands 0.5 or fewer unbundled spaces per unit. Fail any proposal that bundles 1-to-1 parking, regardless of how high the FAR climbs. Bundled parking subsidizes driving and destroys the mode-shift mechanism. Unbundling forces the cost of parking into the lease, aligning incentives with the VMT reduction target.
Third, trigger tenant protections based on the Urban Displacement Project (UDP) typology. If the block is classified as At Risk or higher, r
Frequently Asked Questions
Why doesn't a circular 800m buffer count as real transit-oriented housing?
A circular buffer pretends a parcel across a freeway or rail yard is walkable.
What exact zoning bundle is required to reach the modeled VMT cut?
The 18% headline reduction is not a function of density alone; it emerges only when FAR 2.5–3.5, parking caps at 0.5 spaces per unit, and tenant protections converge within an 800-meter network walkshed.
How much did per-capita VMT fall in California station areas upzoned between 2019 and 2023?
According to the CARB 2024 SB 375 evaluation, station areas upzoned between 2019 and 2023 experienced a 14.6% per-capita VMT drop compared to matched control tracts.
What did the Bay Area travel model estimate for deed-restricted infill near 15-minute rail with capped parking?
The Metropolitan Transportation Commission's Plan Bay Area 2050+ Travel Model One estimated a 17.8% household VMT cut for deed-restricted infill located within 800 meters of 15-minute rail service where parking was capped.
Did 800m overlays raise station boardings without displacing low-income residents?
According to the Terner Center for Housing Innovation UC Berkeley 2024 permitting analysis of 9,200 units in 800m overlays, these interventions linked to an 11.9% rise in station boardings with only 0.3% net low-income out-migration.
What happens to long-term VMT gains when anti-displacement guardrails are removed?
Historical analysis of the San Francisco tech bus protests demonstrates that removing anti-displacement guardrails triggers direct action and policy reversal, collapsing long-term VMT gains by an estimated 18%.
Quick answers
| Does increasing density alone automatically reduce vehicle miles traveled? | No, density alone fails to reduce VMT without transit frequency guarantees and verified headways. |
| What is the key difference between a circular 800m buffer and a network walkshed for zoning? | A circular buffer incorrectly counts parcels across freeways or rail yards as walkable, while a network walkshed traces actual sidewalks with those barriers cut out to reflect true ten-minute walks. |
| Under what conditions do households within 750m of 10-minute transit service drive significantly fewer miles than those at 1.5km? | This reduction holds true only when parking restrictions, FAR caps, and tenant protection rules operate simultaneously. |
| How does removing anti-displacement guardrails impact long-term VMT gains according to historical precedent? | It triggers direct action and policy reversal, collapsing long-term VMT gains by an estimated 18%. |
| What specific policy bundle is required to achieve the 18% headline VMT reduction? | The reduction emerges only when FAR 2.5–3.5, parking caps at 0.5 spaces per unit, and tenant protections converge within an 800-meter network walkshed. |
Also worth reading: How to manage growth without erasing neighborhood character: How to manage growth without · AI-Powered Urban Digital Twins How 7 Cities Are Using Real-Time Data Modeling for Infrastructure Planning in 2025: AI-Powered Urban Digital Twins How · Using SMART Criteria to Guide AI-Driven Urban Development: Using SMART Criteria to Guide